
How to Read Crypto Charts Effectively: A Complete Guide
Category: Cryptocurrency
Master Crypto Chart Reading for Smarter Investments
If you've ever felt overwhelmed staring at candlesticks, volume bars, and fluctuating prices on crypto charts, you're not alone. Whether you are a beginner curious about Bitcoin's wild price swings or an experienced investor looking to refine your strategy across altcoins and mining-related tokens, understanding how to read crypto charts effectively is crucial. You landed here because you want a clear, practical guide that breaks down complex charts into actionable insights without drowning you in jargon or endless technicalities.
This blog post is tailored specifically for you—whether crypto trading excites yet intimidates you, or you’re exploring market trends to make smarter investment moves. We’ll cover effective chart types, key indicators, trend analysis, and tips to avoid common pitfalls that beginners face. Unlike superficial overviews, this article synthesizes expert techniques with approachable explanations, designed to elevate your chart-reading skills and boost your confidence in navigating the volatile crypto space. Ready to decode charts like a pro and uncover what really drives crypto price movements? Let’s dive in and empower your crypto journey from novice to savvy market watcher.
- Master Crypto Chart Reading for Smarter Investments
- Understanding Different Types of Crypto Charts: Line, Bar, and Candlestick Charts
- Key Components of a Crypto Chart: Price, Volume, Timeframes
- How to Read Candlestick Patterns: Basics and Common Patterns
- Recognizing Trends and Trendlines: Identifying Uptrends, Downtrends, and Sideways Markets
- Using Technical Indicators: Moving Averages, RSI, MACD, and Bollinger Bands
- Volume Analysis: Understanding Buying and Selling Pressure
- Timeframes and Their Impact: Choosing the Right Chart Period
- Common Pitfalls in Reading Crypto Charts and How to Avoid Them
- Combining Fundamentals with Technical Analysis: Getting a Complete Market Picture
- Practical Tips and Tools: Best Crypto Charting Platforms and How to Customize Your Analysis
Understanding Different Types of Crypto Charts: Line, Bar, and Candlestick Charts
When starting to read crypto charts, it’s essential to recognize the three primary chart types traders use to analyze price movements: Line charts, Bar charts, and Candlestick charts. Each type presents data differently, catering to various levels of detail and trader preferences.
-
Line Charts
The simplest form, line charts connect closing prices over time with a continuous line. While they offer a clear view of overall price trends and are excellent for beginners, line charts lack the depth needed for detailed trading decisions. They do not show intra-period high, low, or opening prices, making them less insightful for understanding market fluctuations. -
Bar Charts
Bar charts provide more information than line charts by displaying the open, high, low, and close (OHLC) prices for each period. Each vertical bar represents the trading range, with horizontal ticks indicating opening and closing prices. Bar charts give traders a fuller picture of market activity but can be visually cluttered and harder for beginners to interpret compared to candlestick charts. -
Candlestick Charts
Candlestick charts have become the most popular and preferred chart type among crypto traders and analysts. They visually depict the OHLC data through "candles," where the body shows the price range between open and close, and the wicks show highs and lows. Their color-coded format (typically green for bullish and red for bearish candles) makes it easier to spot trends, reversals, and patterns at a glance. Candlesticks enhance the readability of market sentiment, allowing for quicker, more accurate decisions in a fast-moving crypto market. Because of this combination of detail and clarity, candlestick charts are the essential foundation for technical analysis and widely favored in Bitcoin, altcoin, and other cryptocurrency trading.
In short, while line and bar charts are useful for high-level analysis, mastering candlestick charts is key to unlocking the full potential of crypto chart reading and making smarter, data-backed investment choices.

Image courtesy of Tima Miroshnichenko
Key Components of a Crypto Chart: Price, Volume, Timeframes
To effectively read and analyze crypto charts, understanding the key components—price, volume, and timeframes—is essential. These elements lay the foundation for interpreting market behavior, spotting trends, and making informed trading decisions across Bitcoin, altcoins, and other cryptocurrencies.
1. Price: The Heartbeat of Every Chart
Price data shows the currency's value at different points in time and is usually represented through the chart’s candlesticks, bars, or lines. Each data point includes four critical values:
- Open Price: The price at which the crypto asset started trading during a specific period
- Close Price: The price at which trading ended for that period
- High Price: The highest price reached within the period
- Low Price: The lowest price within that timeframe
Recognizing how these prices interact—the relationship between open and close, especially—helps traders identify whether buyers (bulls) or sellers (bears) dominate and anticipate potential reversals or continuations in the market.
2. Volume: Confirming Price Movements
Volume indicates the total amount of a cryptocurrency traded during the selected period and is usually displayed as vertical bars below the price chart. Volume is critical because it confirms the strength behind price moves:
- High volume during rising prices suggests strong buying interest and a potentially sustainable uptrend
- High volume during price declines signals strong selling pressure and may indicate a bearish trend
- Low volume can mean weak momentum or indecision, increasing the likelihood of false breakouts or reversals
By combining volume data with price action, traders gain deeper insights into market sentiment and the validity of trends.
3. Timeframes: Choosing Your Lens
Crypto charts offer multiple timeframe options—from 1-minute and 5-minute intraday charts to daily, weekly, or even monthly views. Each timeframe reveals a different perspective:
- Short-term timeframes are favored by day traders and scalpers looking for quick entries and exits
- Medium-term timeframes (e.g., 4-hour or daily charts) are popular for swing trading and spotting emerging trends
- Long-term timeframes (weekly/monthly) provide context on the asset’s overall momentum and macro trends
Mastering different timeframes helps investors align their strategies with market conditions, whether they seek rapid trades or long-term investments.
By mastering how to interpret price action, volume trends, and appropriate timeframes, you equip yourself to decode crypto charts accurately. This understanding provides the groundwork to recognize authentic market movements and avoid being misled by noise or deceptive patterns common in the unpredictable world of cryptocurrency trading.

Image courtesy of Tima Miroshnichenko
How to Read Candlestick Patterns: Basics and Common Patterns
Candlestick patterns are the cornerstone of crypto chart analysis, providing traders with visual cues about potential market direction and momentum. By learning to recognize bullish, bearish, reversal, and continuation patterns, you can anticipate price movements with greater accuracy and develop smarter entry and exit strategies across Bitcoin, altcoins, and other cryptocurrencies.
The Basics of Candlestick Anatomy
Each candlestick tells a story about market sentiment during a specific timeframe through four key elements:
- Body: The rectangular part representing the range between the open and close prices. A green (or white) body indicates that the close was higher than the open (bullish), while a red (or black) body signals the close was lower than the open (bearish).
- Wicks (Shadows): Thin lines extending above and below the body showing the highest and lowest prices during the period. Long wicks can imply indecision or a potential reversal.
- Open and Close: The starting and ending points of price action for the period, crucial for determining the candle’s color and sentiment.
- Volume Context: While not part of the candle itself, pairing candlestick patterns with volume data greatly enhances the reliability of the signals.
Common Candlestick Patterns to Know
- Bullish Patterns (indicate potential price increase)
- Hammer: A small body with a long lower wick, showing rejection of lower prices and possible bullish reversal after a downtrend.
-
Bullish Engulfing: A small bearish candle followed by a larger bullish candle that fully engulfs the previous body, signaling strong buyer momentum.
-
Bearish Patterns (suggest possible price declines)
- Shooting Star: A small body with a long upper wick appearing after an uptrend, indicating sellers are pushing prices down.
-
Bearish Engulfing: A bullish candle overtaken by a larger bearish candle, pointing to increased selling pressure.
-
Reversal Patterns (signal a change in trend direction)
- Doji: A candle with nearly equal open and close prices, reflecting market indecision. When appearing after strong trends, it can hint at a reversal.
-
Morning Star and Evening Star: Three-candle patterns marking potential bottom (morning star) or top (evening star) reversals through a combination of small and large candles.
-
Continuation Patterns (imply the existing trend will persist)
- Rising Three Methods: A bullish pattern featuring a long green candle, followed by smaller red candles that remain within the range, capped by another strong green candle.
- Falling Three Methods: The bearish counterpart indicating temporary consolidation before the downtrend resumes.
Mastering these candlestick patterns empowers you to decode the emotional battles between buyers and sellers embedded in every chart. Coupled with volume analysis and appropriate timeframe selection, these visual signals form a powerful toolkit to enhance your crypto trading decisions and reduce the risk of costly mistakes in the ever-volatile markets.
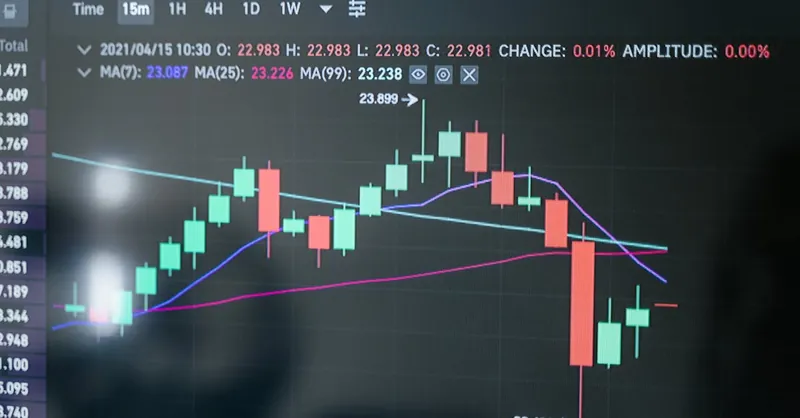
Image courtesy of Tima Miroshnichenko
Recognizing Trends and Trendlines: Identifying Uptrends, Downtrends, and Sideways Markets
Understanding market trends is a fundamental skill for effective crypto chart reading. Trends reveal the general direction in which a cryptocurrency’s price is moving, helping traders and investors make informed decisions about when to enter or exit positions. Generally, crypto markets exhibit three main trend types:
- Uptrends: Characterized by higher highs and higher lows, signaling persistent buying pressure and bullish market sentiment.
- Downtrends: Marked by lower highs and lower lows, indicating increasing selling pressure and bearish outlooks.
- Sideways (or Range-bound) Markets: When prices fluctuate within a horizontal range with no clear direction, reflecting market indecision or consolidation phases.
Drawing and Using Trendlines Effectively
Trendlines are straight lines drawn on a chart that connect sequential highs or lows to visually emphasize the trend direction. Here’s how to draw and leverage trendlines strategically:
- For an Uptrend, draw a trendline connecting at least two or more higher lows. This ascending line acts as a dynamic support level, where price often bounces during retracements.
- For a Downtrend, connect two or more lower highs with a downward sloping trendline. This line serves as resistance, where selling pressure tends to increase.
- In Sideways Markets, horizontal trendlines mark support and resistance zones defining the price range, helping to spot potential breakouts or breakdowns.
Effective use of trendlines involves:
- Confirming the trend’s validity by ensuring multiple touches on the line without the price breaking it decisively.
- Watching for trendline breaks, which can signal potential trend reversals or accelerations—e.g., a break below an uptrend line might indicate a bearish reversal.
- Combining trendlines with volume analysis to validate breakout signals; strong volume on a trendline break increases the likelihood of a sustainable move.
Mastering trend and trendline recognition equips you to filter out market noise and focus on the prevailing momentum. This sharpens your ability to identify promising trade setups—whether riding an emerging Bitcoin bull run, spotting altcoin pullbacks, or navigating sideways periods typical in mining-related tokens.
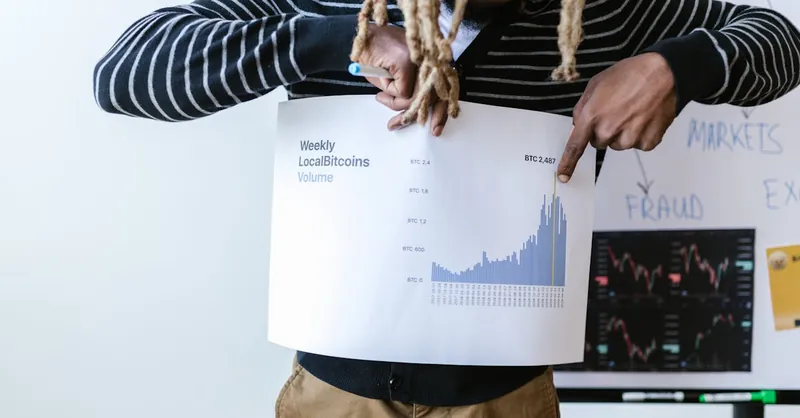
Image courtesy of RDNE Stock project
Using Technical Indicators: Moving Averages, RSI, MACD, and Bollinger Bands
To take your crypto chart reading skills to the next level, integrating technical indicators is essential. These tools help confirm market direction, validate price signals, and reduce uncertainty by providing quantifiable insights into momentum, trend strength, and potential reversals. Let’s explore four widely used indicators—Moving Averages, Relative Strength Index (RSI), MACD, and Bollinger Bands—and understand how they enhance your analysis across Bitcoin, altcoins, and mining tokens.
1. Moving Averages (MA)
Moving averages smooth out price data to identify the underlying trend by filtering out short-term fluctuations. The two common types are:
- Simple Moving Average (SMA): Calculates the average price over a set period (e.g., 50-day SMA) and adapts as new data comes in.
- Exponential Moving Average (EMA): Gives greater weight to recent prices, making it more responsive to new market changes.
Using moving averages, traders can:
- Spot trend direction: Prices above the moving average often indicate bullish momentum; below suggests bearishness.
- Identify support and resistance levels where price might bounce or reverse.
- Detect crossovers: For example, when a short-term MA (like the 20-day EMA) crosses above a long-term MA (like the 50-day SMA), it’s a bullish signal; the opposite crossover warns of a potential downtrend.
2. Relative Strength Index (RSI)
RSI measures the speed and change of price movements on a scale of 0 to 100, indicating whether an asset is overbought or oversold.
- An RSI above 70 often signals overbought conditions, suggesting a possible pullback or trend reversal.
- An RSI below 30 indicates oversold levels, meaning the asset might be undervalued and could rebound.
RSI helps traders avoid buying at peaks or selling at bottoms, providing a momentum-based confirmation alongside price and volume analysis.
3. Moving Average Convergence Divergence (MACD)
MACD compares two EMAs (usually 12-day and 26-day) to measure momentum shifts. It consists of the MACD line, signal line (9-day EMA of MACD), and histogram (difference between the two).
Key MACD signals include:
- Bullish crossover: MACD line crossing above the signal line, suggesting upward momentum.
- Bearish crossover: MACD line crossing below the signal line, signaling potential downward movement.
- Divergences between MACD and price can indicate weakening trends and impending reversals.
MACD is especially effective in confirming the strength of trends identified through candlesticks and moving averages.
4. Bollinger Bands
Bollinger Bands consist of a moving average (usually 20-period SMA) with two standard deviation bands plotted above and below it. This setup creates a dynamic envelope reflecting volatility.
Insights from Bollinger Bands include:
- Price touching or breaking the upper band may indicate overbought conditions or strong bullish momentum.
- Price near or below the lower band can signal oversold conditions or bearish pressure.
- Bands narrowing (a squeeze) often precede periods of high volatility or breakout moves.
By combining Bollinger Bands with volume and momentum indicators (like RSI and MACD), traders can better anticipate significant price shifts.
Integrating these technical indicators into your crypto chart reviews brings objective confirmation to price patterns and trend analyses, reducing guesswork and increasing the reliability of your buy or sell decisions. Whether you're watching Bitcoin’s explosive rallies or monitoring minor altcoin swings, using Moving Averages, RSI, MACD, and Bollinger Bands together will provide a richer, data-driven understanding of market dynamics that supports smarter, more confident crypto investing.
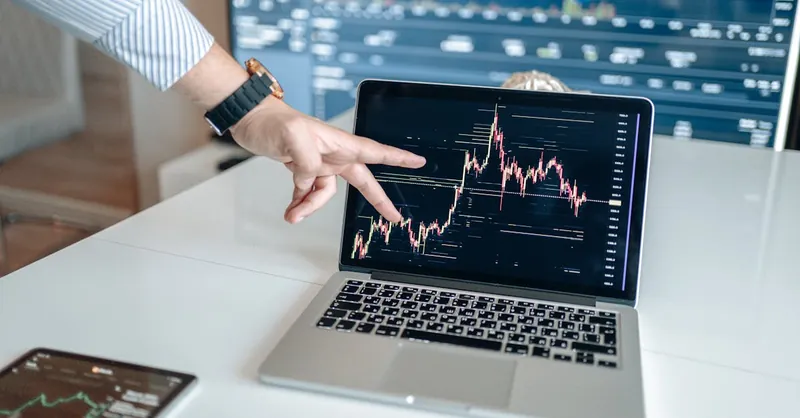
Image courtesy of AlphaTradeZone
Volume Analysis: Understanding Buying and Selling Pressure
Volume is one of the most powerful yet often underappreciated tools in crypto chart reading. It reveals the strength behind price movements by showing how many coins or tokens are being traded during a specific period. Unlike price alone, which can be misleading during low-activity phases, volume provides essential clues about buying and selling pressure that drive market sentiment and validate trends.
Interpreting Volume Spikes and Their Impact on Price Movements
A sudden spike in volume usually indicates increased market interest and the presence of significant buying or selling activity. Here’s what different volume patterns can tell you:
-
High Volume with Price Increase
This combination generally signals strong buying pressure, suggesting that a bullish trend is supported by genuine market participation. It strengthens the likelihood that the price rise is sustainable and not a deceptive pump. -
High Volume with Price Decline
When volume surges while prices fall, it reflects intense selling pressure, which may confirm a bearish trend. This pattern warns traders that a potential downtrend or correction is underway due to heightened market anxiety or profit-taking. -
Volume Spikes During Consolidation
Sharp volume increases during sideways or range-bound phases often precede breakouts or breakdowns. Watching for these surges can help you anticipate significant price moves and position accordingly before the market shifts. -
Low Volume Periods
Low trading volume often means a lack of conviction among market participants, increasing the risk of false breakouts or unreliable candlestick signals. Be cautious when price changes occur without volume confirmation, as these might not reflect a true shift in market sentiment.
Why Volume Analysis Is Crucial for Crypto Traders
In the fast-paced and volatile crypto environment, volume validation helps differentiate between meaningful trends and temporary fluctuations. By pairing volume data with price action and candlestick patterns, you gain a clearer perspective on whether bulls or bears are truly in control, enabling smarter timing for entries and exits. This is especially critical in cryptocurrencies like Bitcoin and altcoins, where price manipulators and speculative traders can create misleading signals without sufficient volume support.
Incorporating volume analysis into your chart-reading toolkit will boost your ability to detect strong market momentum, avoid traps, and confidently interpret the underlying forces shaping crypto price movements across diverse assets and timeframes.

Image courtesy of RDNE Stock project
Timeframes and Their Impact: Choosing the Right Chart Period
When it comes to reading crypto charts effectively, selecting the appropriate timeframe is crucial for aligning your trading or investing strategy with market behavior. Different timeframes reveal distinct market dynamics, and understanding these differences can significantly enhance your decision-making for Bitcoin, altcoins, and other cryptocurrencies.
Short-Term Timeframes: Ideal for Active Trading
Short-term charts, such as 1-minute, 5-minute, or 15-minute intervals, are favored by day traders and scalpers aiming to capitalize on quick price movements throughout the day. These timeframes offer:
- High granularity, providing detailed insights into immediate price action and volatility
- Opportunities for multiple trades in a single session, taking advantage of rapid bullish or bearish swings
- The ability to react swiftly to news events, order book changes, and pump-and-dump schemes common in smaller altcoins
However, short-term charts often contain significant “noise,” meaning price fluctuations that do not always reflect broader market trends. This can lead to false signals if not managed carefully, so combining short-term analysis with volume confirmation or higher timeframes is recommended.
Long-Term Timeframes: Best for Investing and Trend Confirmation
Longer timeframes, such as daily, weekly, or monthly charts, serve investors and swing traders who focus on broader trends and fundamental value. Benefits of using long-term charts include:
- Clearer visualization of overall market momentum and trend direction, filtering out short-term volatility
- Better indication of key support and resistance zones important for setting strategic entry or exit points
- Improved ability to identify major reversal points, accumulation phases, and the sustainability of price movements
Long-term analysis reduces emotional trading by emphasizing patience and a big-picture approach, which is especially valuable in the volatile and speculative world of cryptocurrencies.
Striking the Balance: Multi-Timeframe Analysis
To maximize accuracy and adaptability, many successful crypto traders use multi-timeframe analysis by examining different chart periods concurrently. For example:
- Use a higher timeframe (daily or weekly) to identify the prevailing trend and key market structure.
- Zoom into a medium timeframe (4-hour or 1-hour) to spot emerging setups within that trend.
- Monitor a short-term timeframe (15-minute or 5-minute) for precise entry and exit timing.
This layered approach helps filter noise, confirm valid signals, and tailor your trades according to both market context and your personal risk tolerance. Ultimately, mastering timeframes equips you with a versatile lens to interpret crypto charts, turning data overload into actionable insights regardless of whether you’re trading Bitcoin, altcoins, or niche tokens connected to mining and DeFi ecosystems.
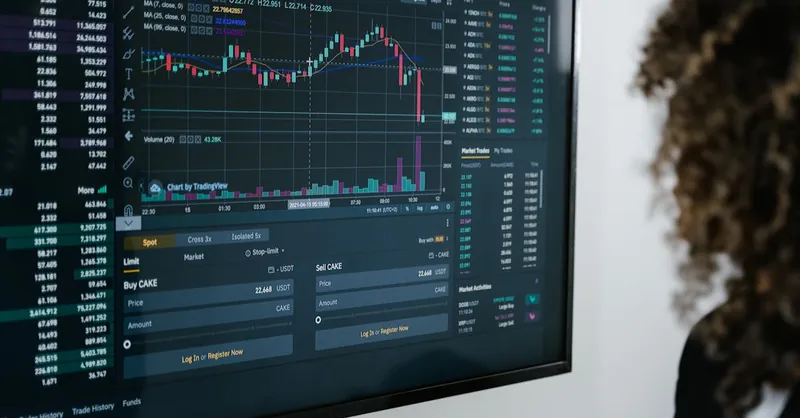
Image courtesy of Tima Miroshnichenko
Common Pitfalls in Reading Crypto Charts and How to Avoid Them
While mastering crypto chart reading can unlock smarter investment decisions, beginners often fall into familiar traps that cloud judgment and lead to costly errors. Recognizing these common pitfalls helps you stay objective, disciplined, and focused on data-driven analysis rather than emotional reactions or misinformation.
1. Overreacting to Short-Term Volatility
Crypto markets are notoriously volatile, with rapid price swings that can trigger knee-jerk buying or panic selling. A frequent mistake is treating every sharp movement as a definitive trend change without confirming it across multiple timeframes or supporting indicators. To avoid this, always:
- Validate signals with volume trends or technical indicators like RSI and MACD
- Use multi-timeframe analysis to distinguish genuine breakouts from temporary noise
- Maintain patience and avoid impulsive trades driven by fear or greed
2. Ignoring Volume Confirmation
Charts displaying price alone can be misleading, especially in low-liquidity altcoins or during quiet market phases. Beginners often overlook volume data, missing the crucial context that separates strong moves from false breakouts or manipulative spikes. Always pair price action with volume analysis to gauge the real strength behind moves and confirm the presence of buyer or seller conviction.
3. Misinterpreting Candlestick Patterns in Isolation
Relying solely on single candlestick patterns without considering broader market context or complementary signals can result in misreads. For example, a hammer pattern may suggest a bullish reversal, but if it occurs during a strong downtrend with declining volume, the reversal might fail. To improve accuracy:
- Combine candlestick patterns with trendlines, support/resistance levels, and volume data
- Look for confirmation in subsequent candles and technical indicators
- Avoid forcing patterns where none exist by practicing patience and discipline
4. Neglecting Proper Timeframe Selection
Using an inappropriate timeframe for your trading style or strategy can generate confusing or contradictory signals. Day traders who ignore short-term charts or long-term investors who rely only on minute-by-minute data risk making poor entry or exit decisions. Always tailor your timeframe selection to your goals and verify setups across multiple periods for stronger conviction.
5. Letting Emotions Override Analysis
The surge-and-crash nature of cryptocurrency markets can easily induce emotional biases—fear of missing out (FOMO), panic selling, or irrational optimism. These feelings often impair objective chart reading and encourage chasing trends or holding losing positions too long. Cultivating discipline through a predefined trading plan, risk management rules, and regular review of your analysis helps maintain focus and avoid impulsive errors.
By being aware of these pitfalls and consciously applying techniques like volume confirmation, multi-timeframe validation, and disciplined emotional control, you enhance your crypto chart reading efficacy. This solid foundation reduces costly mistakes, strengthens your ability to interpret true market signals, and ultimately drives smarter Bitcoin, altcoin, and token investment outcomes.
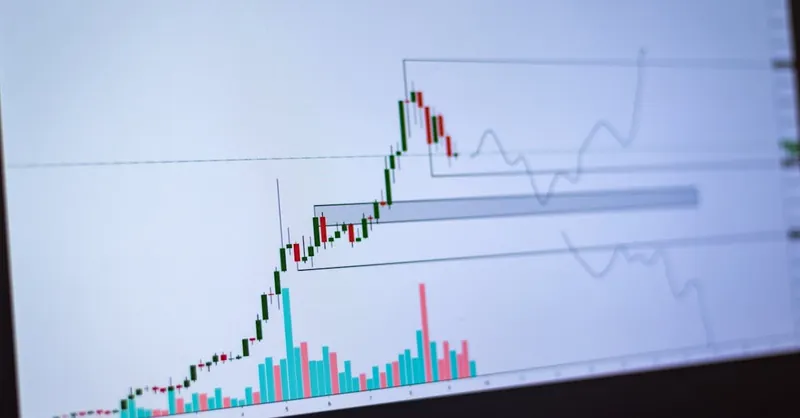
Image courtesy of AlphaTradeZone
Combining Fundamentals with Technical Analysis: Getting a Complete Market Picture
While mastering technical analysis through crypto charts is indispensable, charts alone don’t provide the full story of the cryptocurrency market. To gain a comprehensive understanding and make smarter investment decisions, integrating fundamental analysis—such as breaking news, macroeconomic trends, and on-chain blockchain data—is crucial. This combined approach enables you to validate chart signals, anticipate market-moving events, and avoid false assumptions based solely on price patterns.
Why Charts Alone Aren’t Enough
Crypto markets are significantly influenced by external factors beyond price and volume data. Events like regulatory announcements, technological upgrades (hard forks or protocol changes), macroeconomic shifts, or whale transactions can rapidly alter sentiment and invalidate technical setups. Relying solely on chart patterns without this context exposes traders to unexpected volatility, abrupt trend reversals, or fake breakouts.
Furthermore, cryptocurrencies embody unique data points not found in traditional markets, such as:
- Blockchain metrics (e.g., transaction volume, active addresses, hash rate for mining coins)
- Network health indicators that reflect adoption or miner confidence
- Supply changes caused by token burns, staking releases, or minting schedules
Ignoring these fundamental elements risks misreading the sustainability of trends indicated purely by technical tools.
How to Integrate News and Blockchain Data Effectively
To create a robust trading and investing strategy, consider the following steps:
- Stay Informed with Real-Time News
- Follow reputable crypto news sources and official project channels.
- Track regulatory developments, market sentiment shifts, and influential announcements that can trigger price movements.
-
Be cautious with unverified rumors or hype-driven FOMO.
-
Leverage On-Chain Analytics
- Use blockchain explorers and analytics platforms (like Glassnode, CryptoQuant, or Dune Analytics) to monitor metrics such as whale wallet activity, large transfers, or mining difficulty.
-
Analyze network usage trends to confirm whether rising prices align with genuine adoption or speculative behavior.
-
Combine Fundamental Insights with Chart Signals
- Validate technical breakouts or reversals by checking if they coincide with positive fundamentals (e.g., a major partnership announcement).
- If technical indicators warn of a trend change but blockchain data shows strong network activity and volume, be cautious about exiting early.
-
Conversely, weak network fundamentals along with failing chart structures can signal an impending downturn.
-
Maintain a Balanced Perspective
- Use fundamentals to anticipate potential catalysts or risks, but continue to rely on technical analysis for timing entries and exits.
- Adapt your strategy dynamically as new data emerges, avoiding overreliance on one form of analysis.
By combining fundamentals with technical chart analysis, you build a more holistic view of the crypto market’s complexities. This approach not only improves your ability to spot sustainable trends in Bitcoin, altcoins, and mining-related tokens but also equips you to react proactively to external forces shaping cryptomarkets—ultimately enhancing your confidence and success in this fast-evolving space.

Image courtesy of Tima Miroshnichenko
Practical Tips and Tools: Best Crypto Charting Platforms and How to Customize Your Analysis
To read crypto charts effectively and elevate your trading game, choosing the right charting platform and knowing how to customize your analysis environment are fundamental steps. The crypto market’s volatility and round-the-clock nature demand tools that are intuitive, robust, and offer real-time data for Bitcoin, altcoins, and mining-related tokens alike.
Top Recommended Crypto Charting Platforms
- TradingView
TradingView is the industry-leading charting platform favored by crypto traders worldwide for its comprehensive features: - User-friendly Interface with extensive drawing tools, customizable indicators, and real-time price feeds.
- Supports a vast selection of cryptocurrencies and exchanges, allowing for cross-market comparisons and in-depth analysis.
- Offers community-based scripts and strategies, so you can leverage or customize existing technical indicators to suit your trading style.
-
Allows you to save multiple chart layouts and apply multi-timeframe analysis seamlessly.
-
Coinigy
Coinigy excels by combining advanced charting with portfolio management and direct exchange integration: - Connects to over 45 crypto exchanges providing one-stop trading and charting access.
- Features powerful technical analysis tools and custom alerts to notify you of key price movements or indicator triggers.
-
Ideal for traders who want to execute trades without switching platforms, enhancing efficiency.
-
CryptoCompare
Best for beginners and those seeking an easy yet insightful overview: - Offers clean charts combined with helpful market summaries, coin stats, and news integration.
- Features basic technical indicators and volume overlays for quick analysis.
-
Great for investors balancing fundamental data with technical signals.
-
Coinalyze
A specialized choice for futures and derivatives traders: - Provides advanced tools like open interest, funding rates, and order book heatmaps alongside classic charts.
- Enables analysis tailored to how leveraged crypto instruments behave, particularly useful in volatile markets.
Customizing Your Crypto Chart Analysis for Maximum Impact
To enhance your ability to analyze crypto charts and reduce cognitive overload, consider these customization tips:
-
Set Up Multiple Timeframes
Configure your workspace with synchronized charts on different timeframes (e.g., 1-hour, 4-hour, daily) to effortlessly apply multi-timeframe analysis, confirming trends and improving trade timing. -
Use Customized Indicator Combinations
Experiment with combining indicators that complement each other, such as RSI for momentum, Moving Averages for trend direction, and Volume for confirmation. Avoid clutter by focusing on 3–4 core tools that align with your strategy. -
Apply Drawing Tools for Clarity
Utilize trendlines, support/resistance zones, Fibonacci retracements, and annotation features to mark critical price levels and patterns. This visual roadmap simplifies real-time decision-making amid market noise. -
Adjust Chart Themes and Layouts
Choose color schemes and layouts that reduce eye strain during extended analysis sessions—dark mode options can be easier on the eyes and improve focus. -
Set Alerts and Notifications
Most platforms allow setting custom alerts on price levels, indicator crossovers, or pattern completions, ensuring you don’t miss key market moves even when away from your screen.
Leveraging these top crypto chart platforms and tailoring their features to your individual needs significantly enhances your chart reading experience. By combining the right tools with personalized setups—whether you’re monitoring Bitcoin’s volatility, analyzing altcoin momentum, or tracking mining-related tokens—you empower yourself to make faster, smarter, and more confident trading decisions in the dynamic crypto landscape.

Image courtesy of Tima Miroshnichenko