
How to Read Crypto Charts Effectively: A Beginner’s Guide
Category: Cryptocurrency
Master Crypto Charts with Confidence
Diving into the world of cryptocurrency trading can be overwhelming, especially when faced with those complex-looking charts full of candles, lines, and numbers. Whether you’re a curious beginner eager to understand Bitcoin’s price movements or an experienced altcoin investor refining your strategy, learning how to read crypto charts effectively is crucial to making informed decisions. You probably landed here because you’ve struggled with interpreting price trends, identifying entry or exit points, or just want to decode the mystery behind those candlesticks and volume bars.
This post cuts through the noise and focuses precisely on what you need to know to confidently read crypto charts, regardless of your experience level. Unlike other guides that drown you in jargon or skip the fundamentals, here you’ll find a clear, step-by-step breakdown of chart types, key indicators, market trends, and practical tips to spot potential trades. Whether you’re interested in Bitcoin, altcoins, or mining insights, mastering chart reading will empower your crypto journey and help you navigate volatile markets with ease. Read on to unlock the essential skills that separate casual observers from savvy crypto investors.
- Master Crypto Charts with Confidence
- Understanding the Basics: What Are Crypto Charts?
- Reading Candlestick Charts: The Core of Crypto Analysis
- Time Frames and Their Importance in Crypto Chart Analysis
- Volume Analysis: What the Numbers Tell You
- Common Technical Indicators for Crypto Charts
- Identifying Market Trends and Trendlines
- Spotting Reversals and Breakouts: Key Chart Patterns and Signals
- Combining Multiple Indicators for Better Accuracy
- Avoiding Common Pitfalls in Chart Reading
- Using Crypto Charting Tools and Platforms
Understanding the Basics: What Are Crypto Charts?
At their core, crypto charts are visual tools that display the historical price movements of cryptocurrencies like Bitcoin and altcoins over various time frames. These charts make it easier to spot trends, patterns, and market sentiment at a glance, which is essential for traders and investors aiming to make informed decisions in the fast-paced crypto environment. The most common types of crypto charts—line charts, bar charts, and candlestick charts—each serve unique purposes and offer different levels of detail.
-
Line Charts
The simplest form of crypto chart, line charts plot the closing prices of a cryptocurrency over a specific period, connecting these points with a continuous line. This type is perfect for beginners looking to grasp the overall price trend without being overwhelmed by complex data. However, line charts lack detailed information like intra-day price fluctuations or market volatility. -
Bar Charts
Bar charts add more depth by representing the opening, closing, high, and low prices for a given time frame using vertical bars. Each bar shows the range of prices during a particular interval, making it easier to understand market momentum and volatility compared to line charts. While they provide more insights, bar charts can still be somewhat challenging for new traders to interpret quickly. -
Candlestick Charts
The most popular and informative chart type among crypto traders, candlestick charts combine price action data into visually distinct candles. Each candle displays the opening and closing price as the “body” and the highest and lowest prices as the “wicks” or “shadows.” Candlesticks allow traders to identify market sentiment (bullish or bearish) immediately, spot key reversal points, and analyze patterns that signal buying or selling pressure. Mastering candlestick reading is fundamental to successful crypto trading.
By understanding these basic chart types and their purposes, you lay the groundwork for more advanced technical analysis techniques. Whether you prefer a clean overview or detailed price action insights, knowing how to interpret these charts empowers you to navigate the volatile world of cryptocurrency confidently.
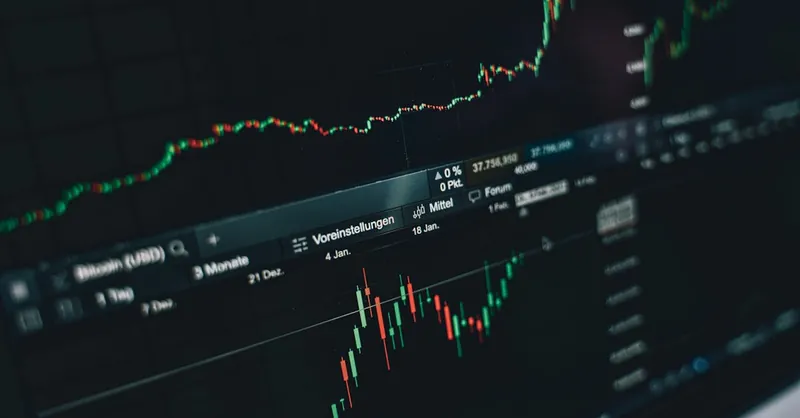
Image courtesy of Alesia Kozik
Reading Candlestick Charts: The Core of Crypto Analysis
Candlestick charts are the cornerstone of effective crypto analysis, offering a powerful visual representation of price action that transcends simple numbers. Each candlestick encapsulates four crucial data points within a specific time frame: Open, High, Low, and Close prices (often abbreviated as OHLC). The “body” of the candle reflects the range between the open and close prices, while the “wicks” or “shadows” extend to the highest and lowest prices reached during that period. This structure makes it easy to gauge market sentiment—whether buyers (bulls) or sellers (bears) dominated the session.
Understanding the anatomy of candlesticks is essential:
1. Bullish Candle: When the closing price is higher than the opening price, the body is typically green or white, indicating upward momentum.
2. Bearish Candle: When the closing price is lower than the opening, the body is red or black, signaling downward pressure.
3. Wicks/Shadows: Long upper wicks suggest selling pressure at higher prices, while long lower wicks indicate buying pressure at lower prices.
Beyond individual candles, interpreting common candlestick patterns sharpens your ability to predict market reversals or continuations. Patterns like the Doji, Hammer, Engulfing, and Shooting Star reveal shifts in trader psychology and potential turning points. For example:
- A Doji, where open and close prices are nearly identical, often signals indecision and possible trend reversal.
- A Hammer indicates strong buying after a sell-off, hinting at a bullish reversal.
- An Engulfing Pattern occurs when a large candle fully “engulfs” the previous one, suggesting a powerful change in momentum.
By mastering these core elements of candlestick charts—analyzing each candle’s body, wicks, and recognized patterns—you unlock a vital skill for reading crypto price movements. This insight equips you to make informed, timely decisions in volatile markets, whether trading Bitcoin, altcoins, or emerging tokens.

Image courtesy of Tima Miroshnichenko
Time Frames and Their Importance in Crypto Chart Analysis
One of the most critical yet often overlooked aspects of reading crypto charts effectively is choosing the right time frame. Crypto markets operate 24/7, and price action can look dramatically different depending on whether you’re viewing a 1-minute chart or a weekly chart. Understanding various time frames helps you tailor your analysis to match your trading style and investment horizon, enabling more precise decisions.
Common Crypto Chart Time Frames
- 1-Minute (1m): Shows price movement every single minute, ideal for scalpers who aim to enter and exit trades within seconds or minutes. While it captures intense market fluctuations, it can be noisy and overwhelming for beginners.
- 5-Minute (5m): Offers a bit more stability while still providing granular short-term data. This timeframe suits day traders focusing on intraday trends and opportunities.
- 1-Hour (1h): Widely used by swing traders to identify meaningful trends that span several hours to days. It smooths out some of the noise present in lower time frames while remaining responsive to market changes.
- Daily (1D): Tracks price movements over entire days and is essential for long-term investors and swing traders who want to understand broader market trends and avoid short-term volatility.
- Weekly (1W): Best for very long-term holders and investors analyzing the overall market cycle or macro trends. Weekly charts filter out daily noise and reveal big-picture momentum.
How to Select the Right Time Frame
Choosing an appropriate chart time frame depends largely on your crypto trading goals:
- Scalpers and Day Traders should prioritize shorter intervals like 1m or 5m charts to catch quick price movements and capitalize on intra-hour volatility.
- Swing Traders often rely on 1h or 4h charts to identify entry and exit points based on multi-day momentum shifts.
- Long-Term Investors prefer daily or weekly charts to evaluate trend sustainability, fundamental price support, and macroeconomic influences affecting Bitcoin and altcoins.
Remember, it’s also common to use multiple time frame analysis—combining insights from both shorter and longer intervals—to confirm trends and reduce the risk of false signals. For example, checking a daily chart to confirm the trend direction before executing a trade identified on a 15-minute chart can significantly improve your decision-making accuracy.
Mastering how to navigate and interpret these various time frames ensures your crypto chart readings align perfectly with your risk tolerance and trading strategy, making you a more confident and successful crypto market participant.

Image courtesy of Tima Miroshnichenko
Volume Analysis: What the Numbers Tell You
While price action reveals where crypto prices have moved, trading volume — the total number of coins or tokens traded during a specific time frame — offers crucial context that deepens your understanding of market dynamics. Volume analysis complements price charts by highlighting the strength or weakness of trends, confirming breakout signals, and revealing potential reversals often missed by price alone.
Why Trading Volume Matters in Crypto Charts
- Confirms Trends: High volume accompanying a price increase indicates strong buying interest and validates an upward trend. Conversely, rising prices on low or declining volume may suggest a weak rally lacking conviction, signaling potential reversal.
- Signals Breakouts and Fakeouts: Breakouts from key support or resistance levels accompanied by surging volume are more likely to sustain momentum. Low-volume breakouts often fail, trapping traders in "fakeouts."
- Indicates Market Strength or Weakness: Sudden spikes in volume during a downtrend may signal capitulation or panic selling, potentially marking a near-term bottom. Similarly, volume drying up can hint at market indecision or consolidation.
- Enhances Pattern Reliability: Classic chart patterns like head and shoulders, triangles, or flags become more reliable when supported by consistent volume trends matching the pattern’s expected move.
How to Incorporate Volume Into Your Crypto Analysis
- Always compare volume bars alongside candlestick movements on your charts—look for volume surges that confirm price moves.
- Use volume in conjunction with other indicators such as moving averages or RSI (Relative Strength Index) to gauge momentum strength.
- Pay attention to volume divergence, where price forms higher highs but volume declines, often a red flag for trend exhaustion.
- Recognize that volume patterns vary between different cryptocurrencies and market conditions, so calibrate your analysis to the specific asset you’re trading.
Mastering volume analysis reinforces your crypto chart reading skills by unveiling the intensity behind price moves. This knowledge empowers you to distinguish genuine market shifts from false signals, improving your timing and confidence in every Bitcoin or altcoin trade.

Image courtesy of Tima Miroshnichenko
Common Technical Indicators for Crypto Charts
To elevate your crypto chart reading skills beyond basic candlesticks and volume, understanding technical indicators is essential. These powerful tools help you interpret market momentum, identify potential reversals, and confirm trends, providing actionable insights for trading Bitcoin and altcoins. Let’s explore some of the most widely used indicators and how to apply them effectively.
1. Moving Averages (MA)
Moving Averages smooth out price data to highlight the underlying trend by averaging prices over a set period. The two main types are:
- Simple Moving Average (SMA): Calculates the average price over a fixed number of periods, giving equal weight to each price point.
- Exponential Moving Average (EMA): Gives more weight to recent prices, making it more responsive to current market action.
How to use:
- MAs help identify trend direction—prices above the MA suggest an uptrend, while prices below hint at a downtrend.
- The popular 50-day and 200-day MAs are crucial for spotting long-term support and resistance.
- Crossovers, like when the 50-day MA crosses above the 200-day MA (a “golden cross”), often signal strong bullish momentum.
2. Relative Strength Index (RSI)
The Relative Strength Index (RSI) is a momentum oscillator that measures the speed and change of price movements on a scale from 0 to 100. It helps determine whether a cryptocurrency is overbought or oversold.
How to interpret:
- An RSI above 70 typically indicates overbought conditions, suggesting a possible price correction or pullback.
- An RSI below 30 signals oversold conditions, hinting at potential buying opportunities or trend reversals.
- RSI divergence, where price moves in the opposite direction of RSI, can also warn of weakening trends.
3. Moving Average Convergence Divergence (MACD)
The MACD indicator tracks the relationship between two EMAs (usually 12-day and 26-day) and the difference between them is plotted as the MACD line. A 9-day EMA of the MACD serves as the signal line.
Key signals:
- When the MACD line crosses above the signal line, it generates a bullish signal to consider buying.
- A crossover below the signal line is bearish, implying selling pressure.
- The distance between MACD and signal lines indicates momentum strength, while divergence from price trends can predict trend changes.
4. Bollinger Bands
Bollinger Bands consist of a middle band (typically a 20-period SMA) and two outer bands set two standard deviations above and below the middle band. These bands expand and contract based on market volatility.
What to look for:
- When price touches or moves outside the upper band, the asset might be overbought, signaling a potential pullback.
- Touching the lower band could indicate oversold conditions and a possible bounce.
- A squeeze, where bands narrow sharply, often precedes a significant price breakout or breakdown.
Incorporating these technical indicators into your crypto chart analysis enriches your understanding of market dynamics, offering multiple confirmation points before making trades. Combining indicators thoughtfully—such as using RSI and MACD together or verifying bullish crossovers with volume spikes—enhances accuracy and helps you navigate the notoriously volatile crypto markets with greater confidence. Mastering these tools will put you well ahead in your crypto investing journey.
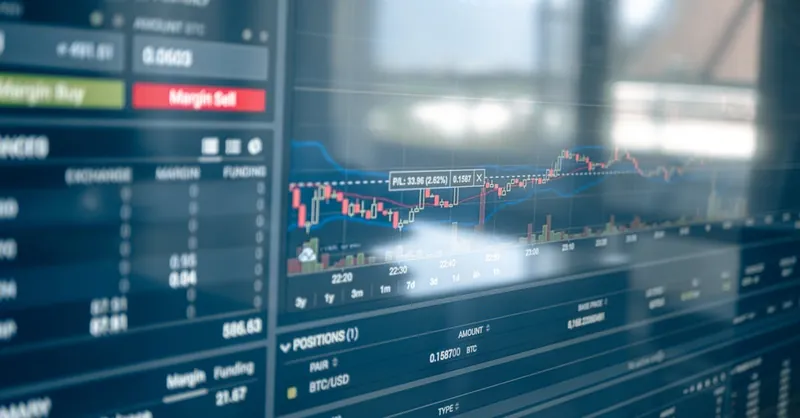
Image courtesy of AlphaTradeZone
Identifying Market Trends and Trendlines
Understanding how to identify market trends is a cornerstone of effective crypto chart reading. Trends indicate the prevailing direction of a cryptocurrency’s price over time, helping traders and investors anticipate future movements and make smarter decisions. Generally, market trends fall into three categories:
-
Uptrend (Bullish Market)
An uptrend is characterized by higher highs and higher lows on the chart, signaling increasing buying interest and upward price momentum. To spot an uptrend, look for a sequence of price points where each successive low is higher than the previous one, and prices consistently push beyond earlier peaks. Drawing a trendline along these ascending lows can serve as a visual guide to support levels where price might bounce back during pullbacks. -
Downtrend (Bearish Market)
A downtrend shows lower highs and lower lows, reflecting sustained selling pressure. This pattern is identified when each successive high and low falls below the prior ones. Plotting a trendline connecting these descending highs acts as a dynamic resistance, indicating potential zones where prices may struggle to break higher and often retreat. -
Sideways or Range-Bound Market
In this scenario, the price oscillates within a relatively tight horizontal range without forming clear higher highs or lower lows. This consolidation phase usually happens when market participants are uncertain, and neither buyers nor sellers dominate. Identifying clear support and resistance levels—the horizontal boundaries where prices repeatedly bounce off or get rejected—is key for trading ranges successfully.
How to Use Trendlines and Support/Resistance Levels Effectively
- Drawing Trendlines: Connect at least two or three significant swing highs (for downtrends) or swing lows (for uptrends) to establish a reliable trendline. The more touches a trendline has without being broken, the stronger and more significant it becomes.
- Support Levels: These are price levels where demand historically outweighs supply, causing prices to “bounce” upward. Watch for repeated price rebounds along these levels on your charts, especially when combined with high volume, to confirm strong support.
- Resistance Levels: These mark price points where selling interest exceeds buying, often capping upward moves. Prices tend to reverse or consolidate near resistance, which can be identified by horizontal lines touching multiple peaks.
- Trendline Breaks: When the price decisively breaks through a trendline or key support/resistance level with increased volume, it often signals a potential trend reversal or acceleration. However, false breakouts occur frequently in crypto, so combining this with other indicators and volume analysis is vital.
Recognizing and drawing accurate trendlines plus pinpointing solid support and resistance levels on crypto charts allows you to interpret market structure with confidence. This approach reveals when a cryptocurrency like Bitcoin or an altcoin is trending strongly, consolidating, or reversing—enabling you to time entries and exits more effectively and reduce risk in your trades.
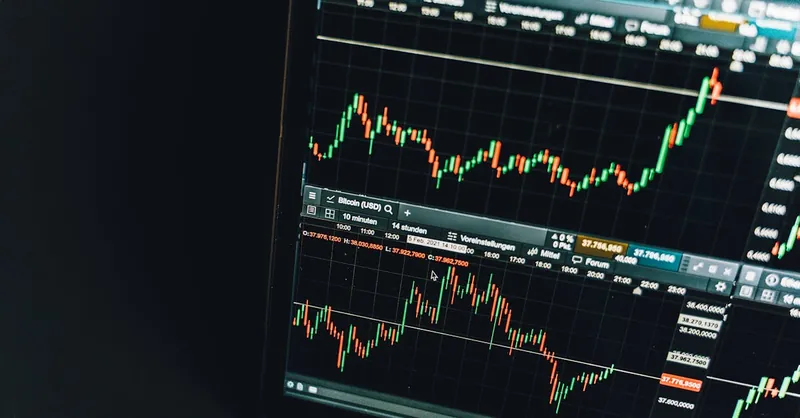
Image courtesy of Alesia Kozik
Spotting Reversals and Breakouts: Key Chart Patterns and Signals
Mastering the ability to spot reversals and breakouts on crypto charts is a game-changer for timing your trades effectively. Reversals indicate potential shifts in market direction—signaling when an uptrend may turn bearish or vice versa—while breakouts show price movements beyond established support or resistance levels, often triggering strong momentum moves. Recognizing these patterns early can help investors optimize entry and exit points, reduce risk, and capitalize on significant market opportunities across Bitcoin and altcoins.
Common Reversal Patterns to Watch For
- Double Top and Double Bottom
- A Double Top pattern forms after an uptrend when the price hits a resistance level twice but fails to break through, indicating weakening buying pressure and a likely downward reversal.
-
The Double Bottom occurs in a downtrend when price tests a support level twice and fails to drop lower, hinting at a bullish reversal.
-
Head and Shoulders / Inverse Head and Shoulders
- The Head and Shoulders pattern is a strong bearish reversal formation consisting of three peaks: a higher middle peak (head) flanked by two lower peaks (shoulders). Its completion often signals a trend reversal to the downside.
-
The Inverse Head and Shoulders flips this concept, marking a bullish reversal after a downtrend.
-
Engulfing Patterns and Dojis
- As discussed earlier, a Bullish Engulfing candle following a downtrend suggests buyers overpowering sellers, signaling a possible bottom.
- Bearish Engulfing indicates a sell-off after an uptrend.
- A Doji near support or resistance hints at market indecision and often precedes reversals.
Recognizing Breakouts and Their Confirmation
Breakouts happen when price decisively moves beyond a support, resistance, or trendline level, often accompanied by increased volume which validates the strength of the move. Key points include:
- Ascending / Descending Triangles: Price compresses within a narrowing range before breaking out in the triangle’s direction, usually continuing the trend momentum.
- Cup and Handle: A bullish breakout pattern where the price forms a rounded bottom (cup), followed by a consolidation (handle), then bursts upward.
- Volume Confirmation: Always look for a surge in trading volume during breakouts, as this confirms genuine interest and reduces the risk of a false breakout or “fakeout.”
- Retest of Breakout Levels: After breaking out, prices often retest the broken resistance (now support) or support (now resistance) before resuming the trend. Successful retests offer lower-risk entry points.
Mastering how to interpret these reversal and breakout signals enhances your ability to anticipate major price moves and execute trades with precision. Combining pattern recognition with volume analysis, trendlines, and technical indicators maximizes your chance of identifying high-probability setups in the volatile crypto market. This skillset empowers both new and seasoned crypto investors to time their entries and exits smarter, reducing losses and capturing profitable opportunities across Bitcoin and altcoins alike.

Image courtesy of Tima Miroshnichenko
Combining Multiple Indicators for Better Accuracy
To build a robust and reliable crypto trading strategy, relying on a single indicator or chart pattern rarely suffices—markets can be deceptive, and false signals abound. The true power of crypto chart analysis emerges when you combine multiple indicators, chart patterns, and volume analysis to confirm trends, reversals, and breakout signals. This layered approach reduces risk, increases confidence, and enhances decision-making accuracy across Bitcoin, altcoins, and mining-related investments.
How to Blend Chart Patterns, Volume, and Technical Indicators Effectively
-
Confirm Chart Patterns with Volume
A classic bullish or bearish pattern—like a head and shoulders or a double bottom—gains strength and validity when accompanied by increasing trading volume at key breakout points. Volume surges confirm genuine market interest, while low volume raises red flags about potential fakeouts. -
Use Technical Indicators as Additional Filters
Integrate momentum and trend-following indicators such as RSI, MACD, or Moving Averages to verify if the chart pattern aligns with the overall market momentum. For example, spotting a bullish engulfing candle near oversold RSI levels or during an MACD bullish crossover can sharpen your entry precision. -
Multiple Time Frame Alignment
Cross-check signals across various time frames—a breakout on a 15-minute chart backed by an uptrend confirmation on the daily chart increases the odds of a sustained move. This multi-time frame perspective helps filter out market noise and prioritize high-probability setups. -
Watch for Indicator Divergence
Divergences between price action and technical indicators (e.g., price making higher highs while RSI forms lower highs) often precede reversals. Combining these insights with candlestick patterns and volume spikes provides early warnings for trend exhaustion or turning points.
By blending chart patterns, volume, and technical indicators thoughtfully, you transform a fragmented set of signals into a coherent trading thesis. This synergy not only improves the accuracy of your market predictions but also equips you with a disciplined framework to manage risks and capitalize on volatile crypto market opportunities more confidently. Remember, in crypto trading, the best setups emerge when different analytical tools tell the same story—giving you the edge over less-prepared investors.

Image courtesy of Tima Miroshnichenko
Avoiding Common Pitfalls in Chart Reading
Even the most detailed crypto charts and sophisticated indicators can lead traders astray if not used carefully. One of the most frequent mistakes beginners make is over-reliance on a single technical indicator or pattern without cross-verifying signals. For example, blindly trusting an RSI reading without considering volume trends or broader market context can result in premature entries or missed exits. Similarly, interpreting isolated candlestick patterns without confirmation from trendlines or other tools often leads to false assumptions about price direction.
Another common pitfall is misinterpreting signals due to emotional bias or impatience. Crypto markets are highly volatile, and impulsive reactions to short-term fluctuations often override objective analysis. Beginners may confuse temporary pullbacks with full trend reversals, or jump into trades based on hype rather than chart evidence. Failing to consider multiple time frames also limits perspective, causing traders to chase noise on short intervals while ignoring the broader trend.
To avoid these errors, always adopt a holistic approach to chart reading by:
- Using multiple indicators in combination to validate signals.
- Confirming breakout or reversal patterns with volume and trend analysis.
- Analyzing charts across different time frames to filter out false signals.
- Maintaining discipline by sticking to predefined entry and exit criteria rather than reacting emotionally.
By recognizing and steering clear of these common mistakes, you improve your ability to interpret crypto charts accurately, avoid costly errors, and develop stronger trading discipline. This strategic mindset elevates your crypto trading from guesswork to informed, data-driven decisions, setting you apart as a savvy market participant.
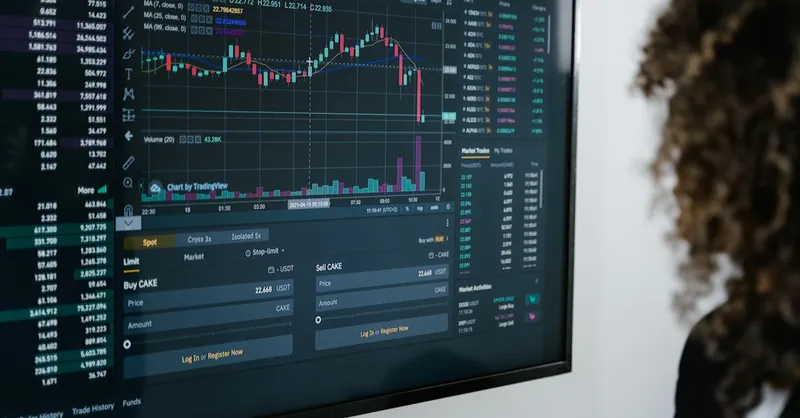
Image courtesy of Tima Miroshnichenko
Using Crypto Charting Tools and Platforms
Navigating the world of crypto charts effectively requires not just knowledge, but also the right charting tools and platforms that offer reliable data, intuitive interfaces, and powerful analysis features. Whether you are a beginner learning to read Bitcoin price trends or an advanced altcoin trader deploying complex strategies, the choice of chart platform can significantly impact your success. Let’s review some of the most popular crypto charting tools—TradingView, Binance Charts, and Coinbase Pro—highlighting their key features and best use cases.
1. TradingView: The Gold Standard for Crypto Charting
TradingView stands out as the premier charting platform favored by thousands of crypto traders worldwide. It offers a comprehensive suite of advanced chart types, 100+ technical indicators, and custom scripting capabilities via Pine Script—ideal for creating personalized trading strategies and alerts. Its clean, highly customizable interface supports multiple time frames alongside live price data for Bitcoin, Ethereum, and thousands of altcoins across various exchanges.
- Best for: Traders who want deep technical analysis tools, multi-time frame charts, and social features like idea sharing and community discussions.
- Unique Features:
- Extensive drawing tools for trendlines, Fibonacci retracements, and pitchforks.
- Real-time alerts on price movements or indicator signals.
- Access to global crypto market data integrated with stocks, forex, and commodities for diversified analysis.
2. Binance Charts: Integrated and Exchange-Centric
As one of the largest cryptocurrency exchanges globally, Binance offers built-in charting tools that combine robust trading functionality with seamless execution. Binance Charts provide real-time candlestick charts, volume indicators, and essential technical overlays directly on the trading platform.
- Best for: Active traders who want quick access to live charts while placing orders without leaving the exchange.
- Key Features:
- Direct linkage between charts and order book for swift trade execution.
- Multiple chart styles and selectable time frames suitable for day trading and scalping.
- Integration with Binance Futures for margin trading insights.
3. Coinbase Pro: Simplified Yet Effective for Beginners and Intermediate Traders
Coinbase Pro offers a user-friendly charting experience ideal for those starting in crypto trading or investors who prefer simplicity combined with reliability. It features real-time price charts with basic technical indicators such as moving averages and RSI to help identify market trends without overwhelming complexity.
- Best for: New traders prioritizing ease of use and reliability from one of the most trusted cryptocurrency exchanges in the U.S.
- Notable Features:
- Streamlined interface paired with secure, regulated exchange access.
- Basic drawing and annotation tools to mark important price points.
- Convenient linking between chart analysis and order placement for efficient trade management.
Selecting the right crypto charting platform depends on your individual trading style, technical analysis needs, and preferred user experience. For deep technical research and community-driven insights, TradingView is unparalleled. If you prioritize integrating charting with fast on-exchange trading, Binance Charts excel. For beginners or users seeking ease and security, Coinbase Pro provides all the essentials. Utilizing these platforms effectively can dramatically enhance your ability to interpret crypto charts, time your trades accurately, and maximize profit potential across Bitcoin and altcoins.
Image courtesy of Jonathan Borba